
Enrollment Data in Context
Understanding Changes at WWCC Clarkston
At Walla Walla Community College, we’re committed to being transparent and responsible stewards of our resources. As we navigate shifting student needs and broader trends in higher education, we’ve taken time to carefully review enrollment patterns and how we deliver instruction across our campuses.
Over the past several years, in-person enrollment in Arts and Sciences courses at our Clarkston campus has steadily declined. This change has been shaped by a mix of regional demographic shifts, the lasting effects of the pandemic, evolving workforce demands, and growing interest in online learning.
To ensure we continue serving students effectively and sustainably, the college made the difficult—but thoughtful—decision to adjust faculty staffing in Clarkston in alignment with current enrollment and instructional needs.
This page provides:
-
-
-
- Key trends impacting higher education and our region
- WWCC enrollment data over the last decade
- Class fill rates at Clarkston, Walla Walla, and Online
- Insights into the rise and stabilization of online learning
-
-
Impactful Events Affecting Clarkston
What’s Influencing Enrollment?
- 2010 – Tuition reciprocity ended between WA and ID; LCSC began offering reduced tuition to Asotin County residents
- 2010s – Lewiston-Clarkston region experiences aging population and fewer young adults
- 2020–present
- WWCC, like many colleges, saw a sharp drop in enrollment during the pandemic; overall enrollment remains about 16% below pre-COVID levels
-
- A tight labor market and rising wages post-pandemic have made it easier for people to find decent-paying jobs without a degree. Washington’s rising minimum wage and expanded worker benefits have made service-sector jobs more financially sustainable, reducing the urgency for many to enroll in college—especially adult learners.
- 2025–2035
- Fewer high school graduates are expected due to lower birthrates after the 2008 recession
-
- Higher education is now more competitive, with nearby institutions like WSU, U of I, and LCSC offering local tuition discounts and expanded online options. Students have more choices, and geographic boundaries matter less than they used to.
These broader forces—economic, policy-driven, and competitive—are all influencing enrollment at WWCC Clarkston. We’re adapting through program review, flexible learning options, and workforce-aligned offerings.
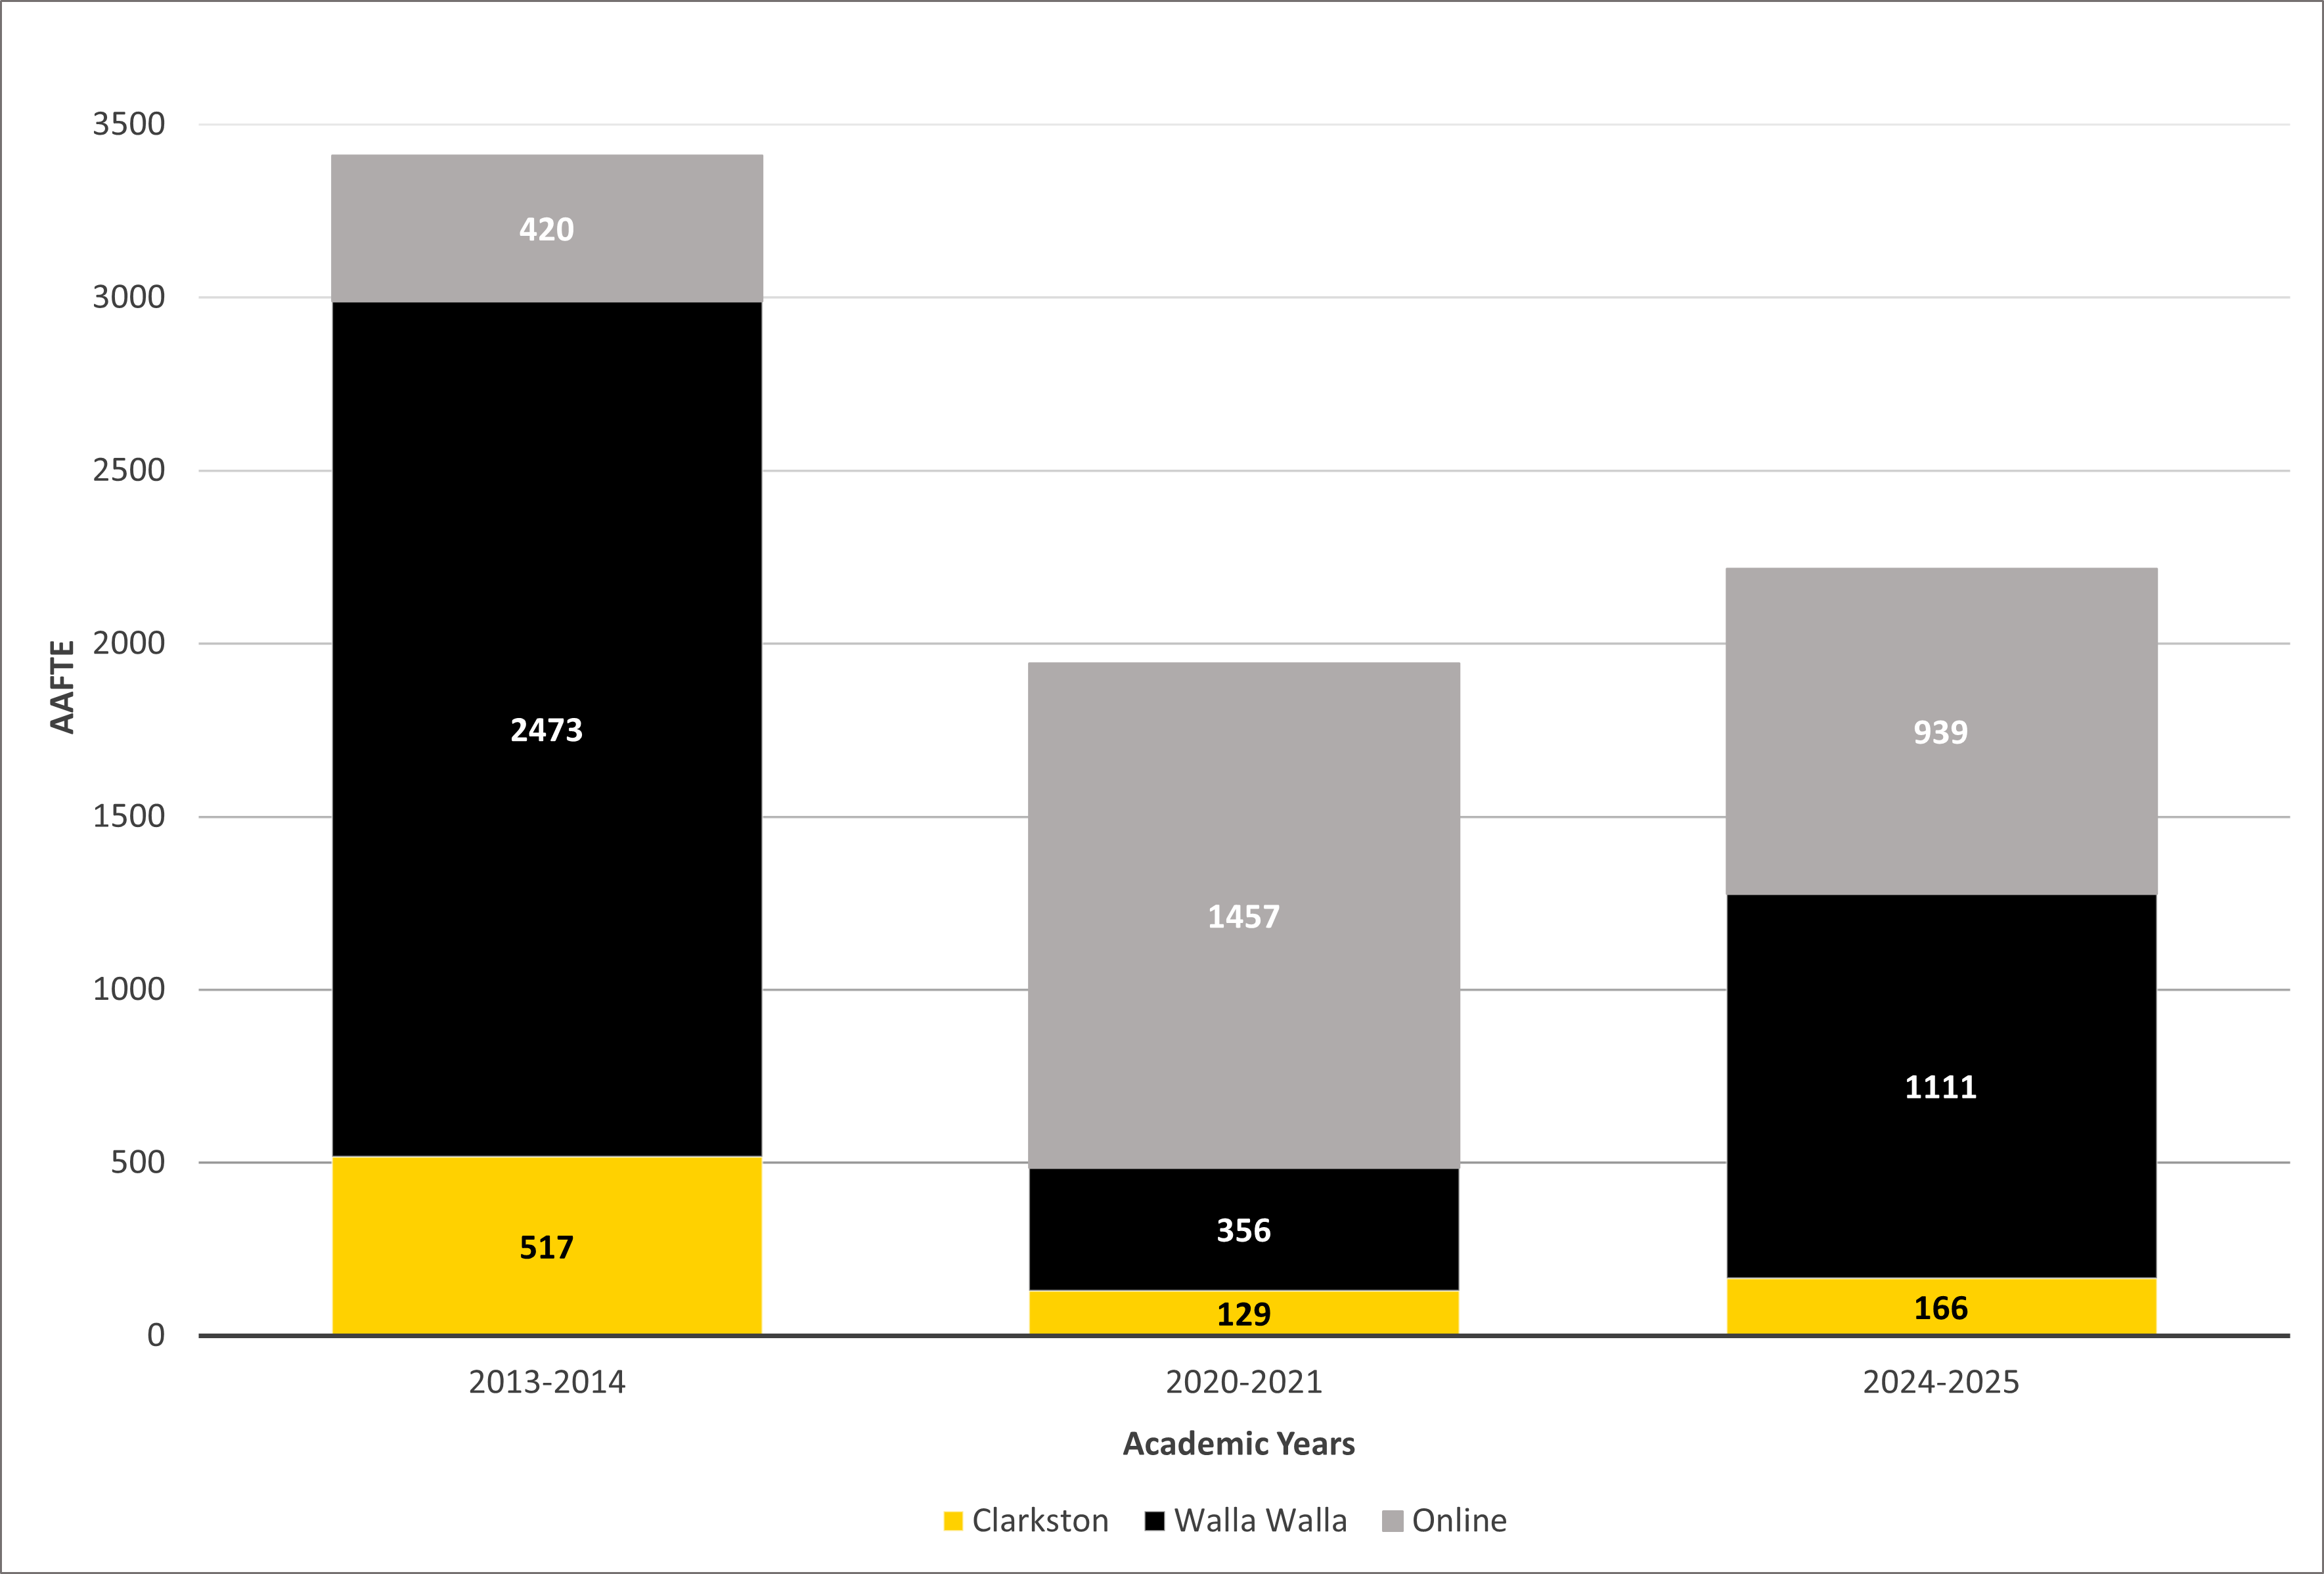
Student AAFTE Enrollment
Click image to enlarge
FTE includes both state and contract funded (Running Start) students at each location listed.
Enrollment Trends and AAFTE
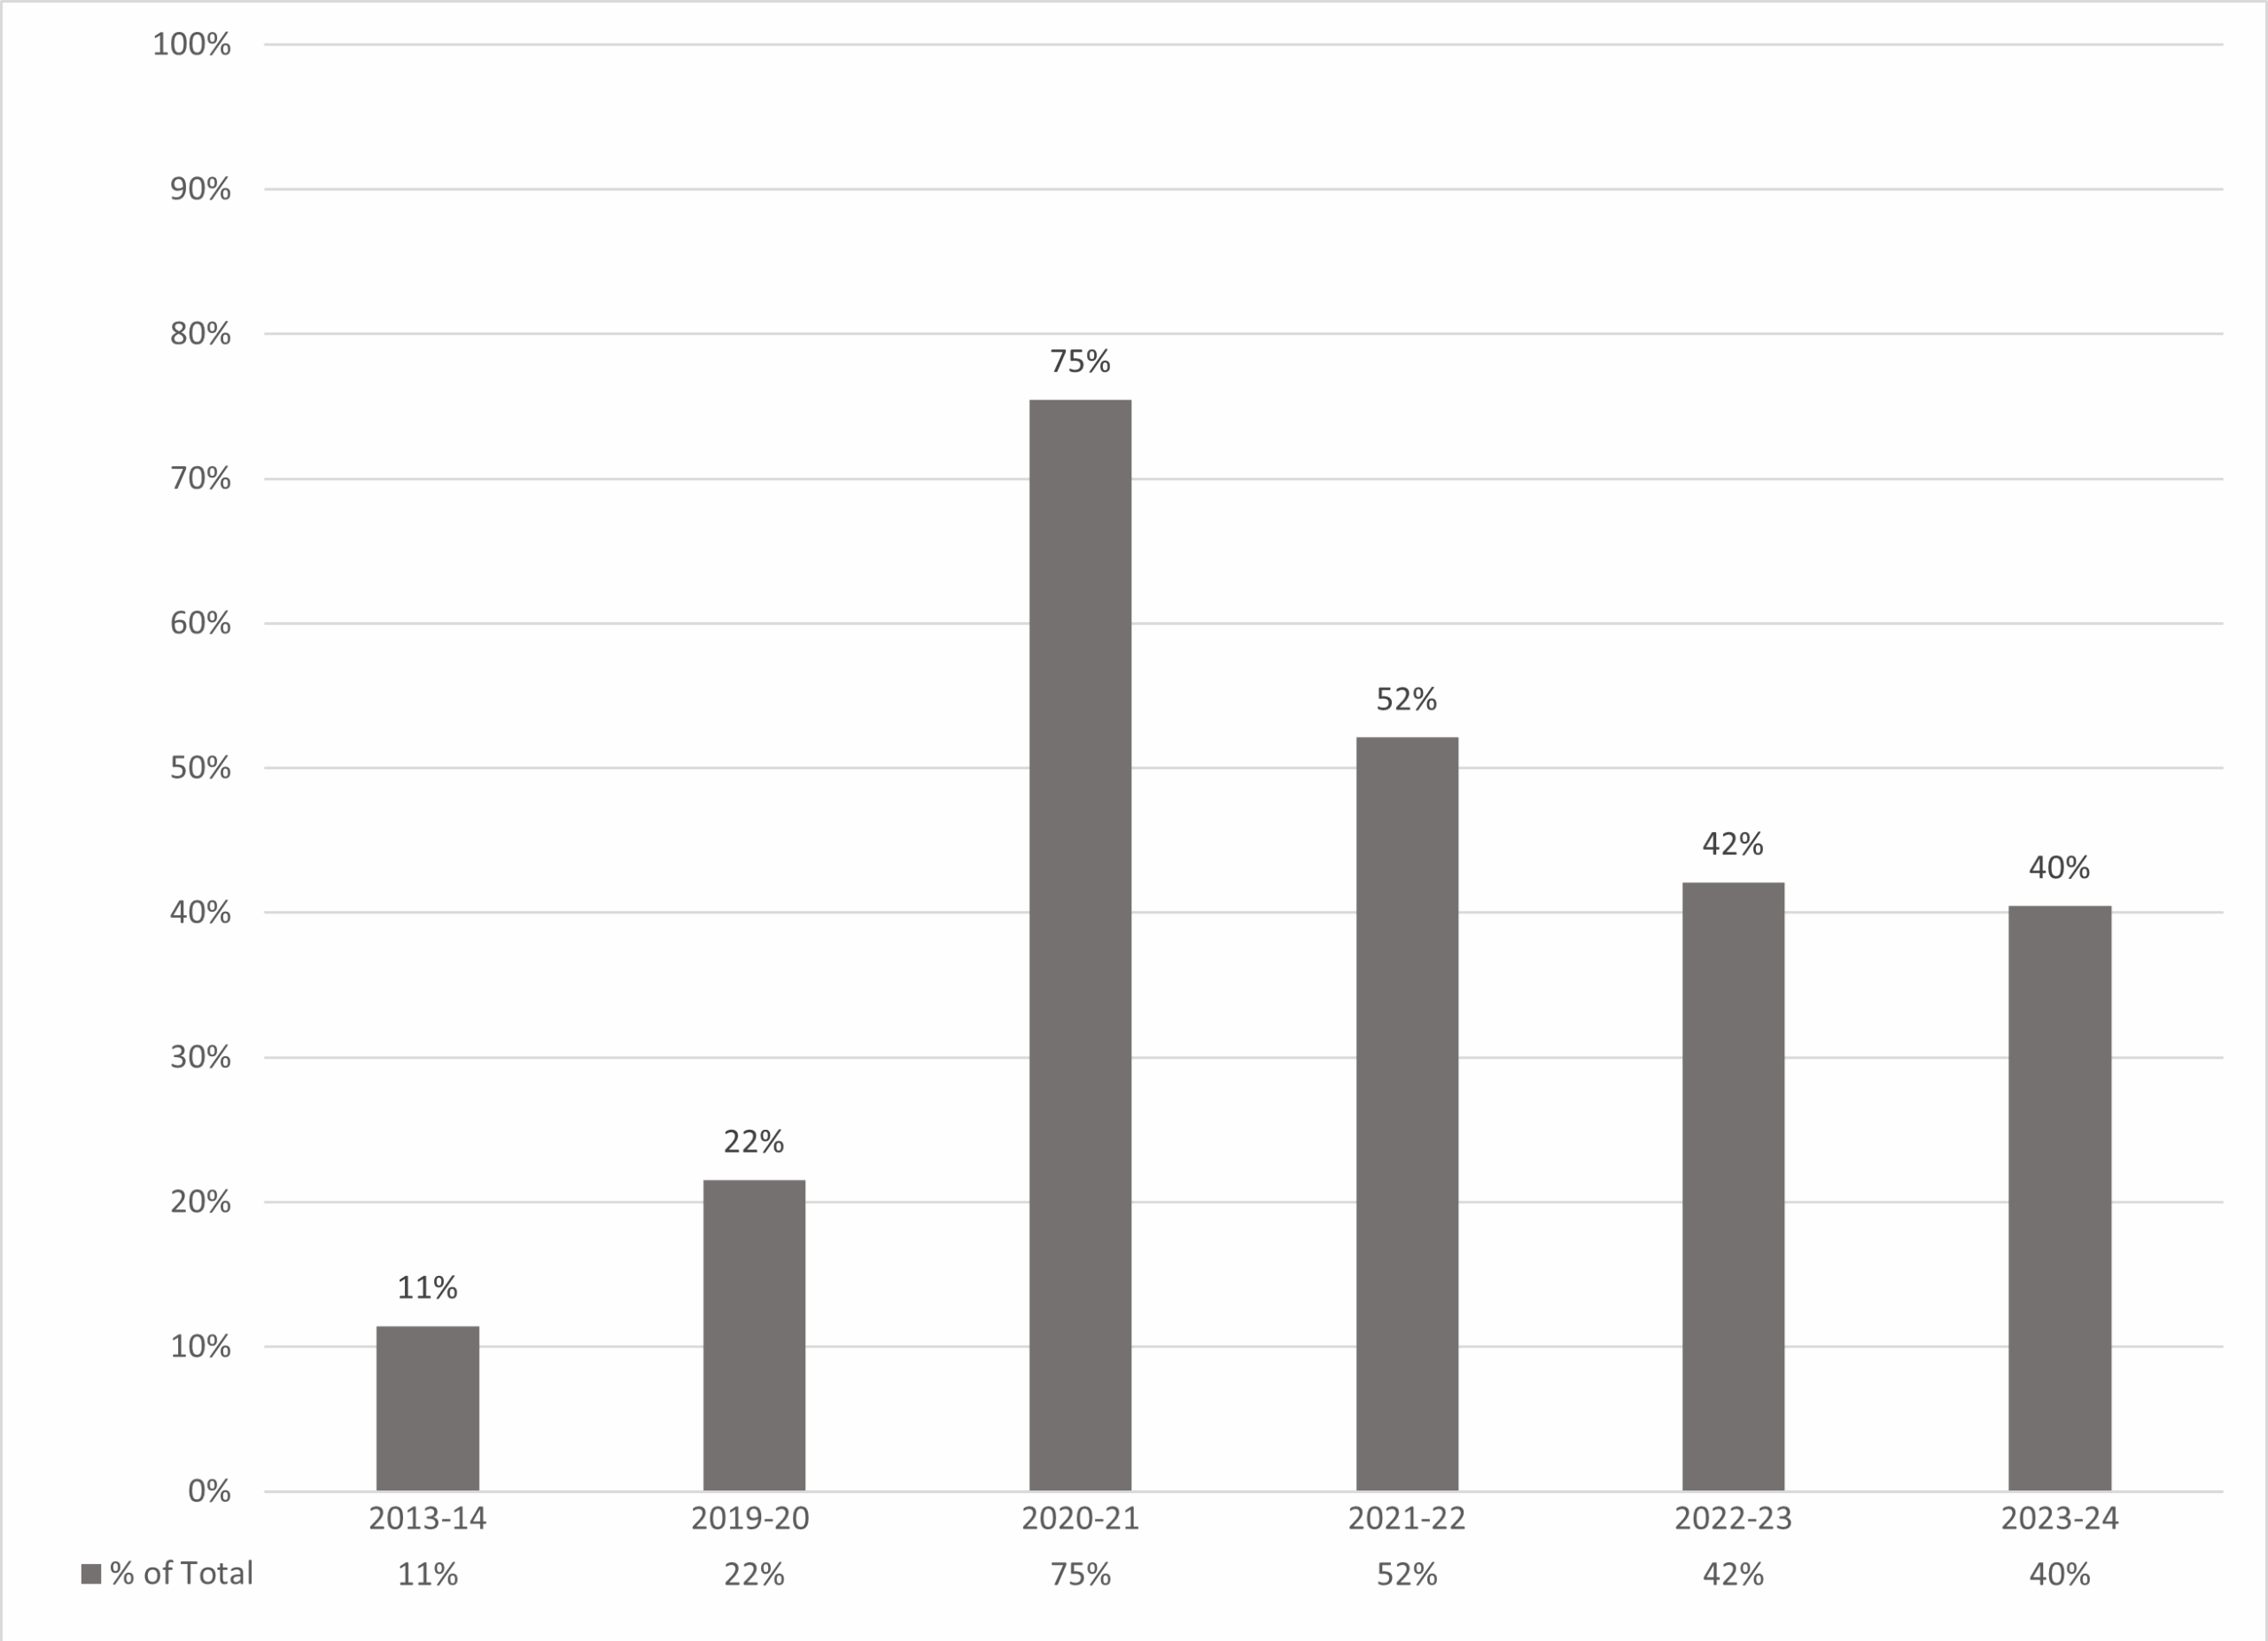
WWCC enrollment, measured by Annual Average Full-Time Equivalent (AAFTE), peaked in 2013–14 and has gradually declined since. While in-person instruction at the Walla Walla campus has begun to recover, Clarkston’s in-person numbers remain lower. Meanwhile, online learning has grown and stabilized, now making up about 40% of total course offerings.
AAFTE = Total credits earned ÷ 45. Includes both state-funded and Running Start students.
Understanding Course Fill Rates
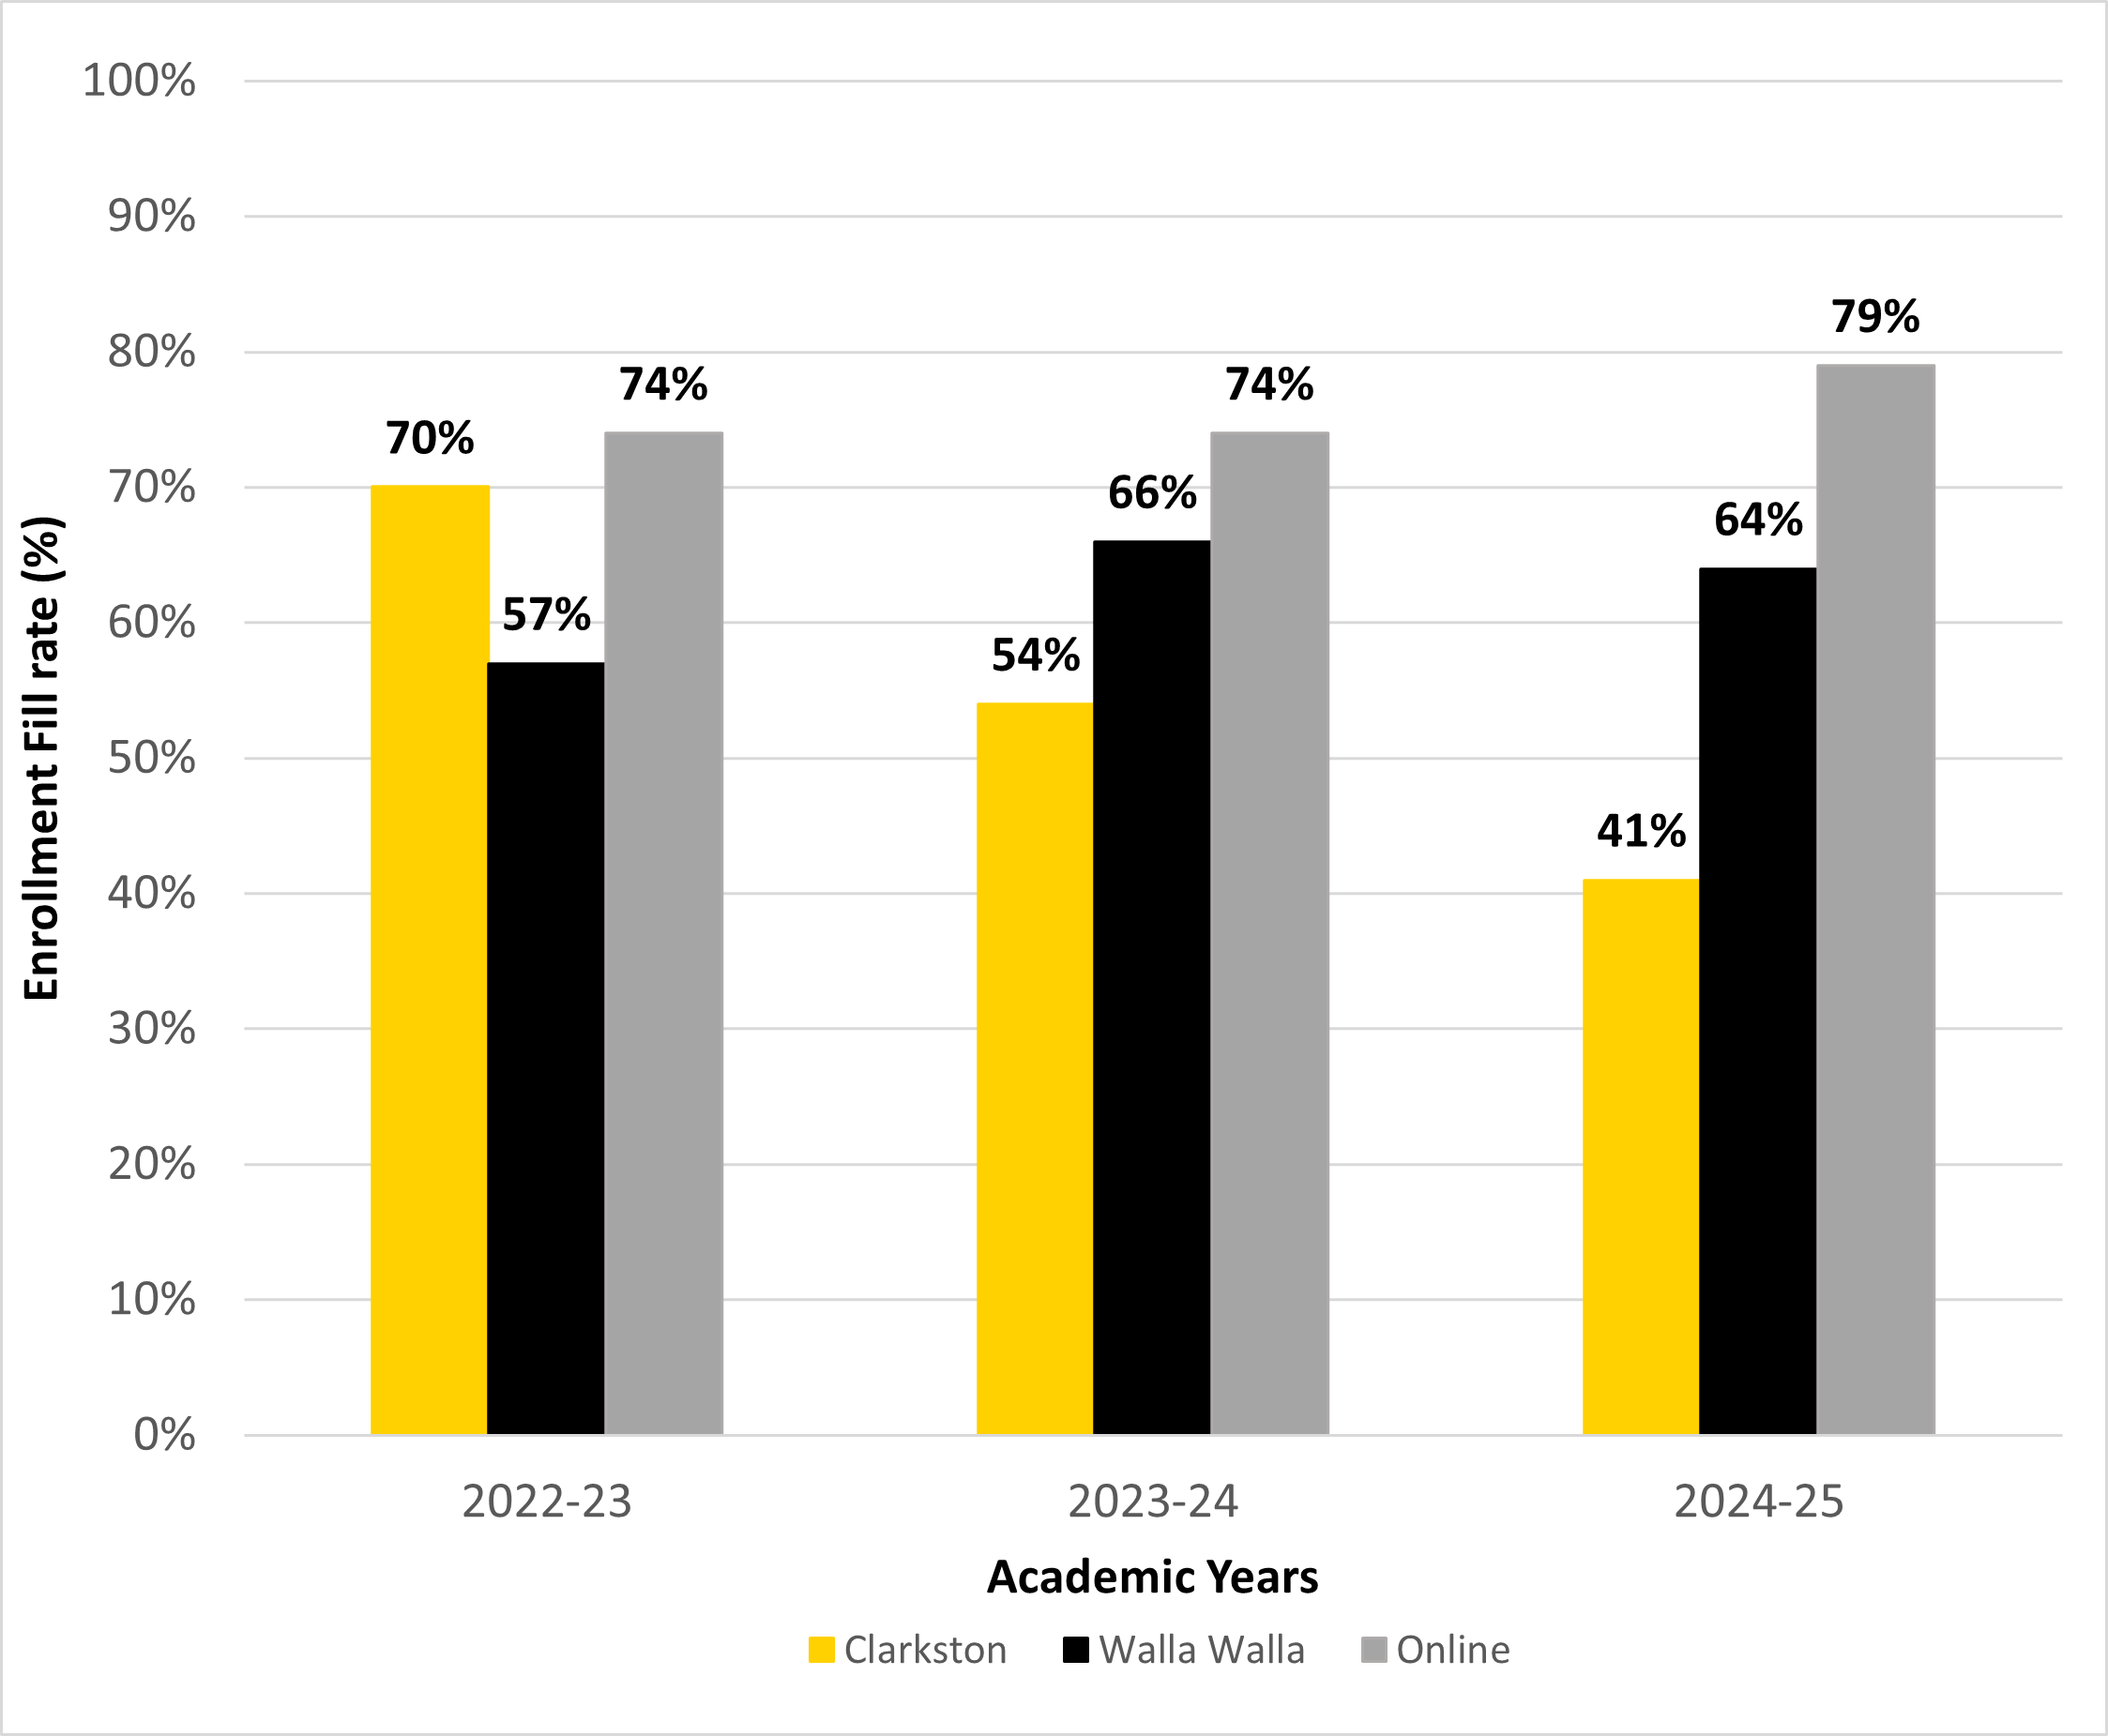
Course fill rates indicate how many students are enrolled in a class compared to the maximum allowed. A class capped at 24 students is considered full with 24 enrolled (100% fill rate). Lower fill rates can make it difficult to justify offering a class due to cost. Recent data shows fill rates vary across campuses and delivery formats.
Fill Rates of A&S
 Click image to enlarge
Data represented include both state and contract funded (Running Start) enrollments for Arts and Science courses above 100 level at Clarkston, Walla Walla, and Online locations disaggregated over the last three years – 2022-2025. (Note: This data set excludes the Nursing-specific PHIL and PSYC courses).
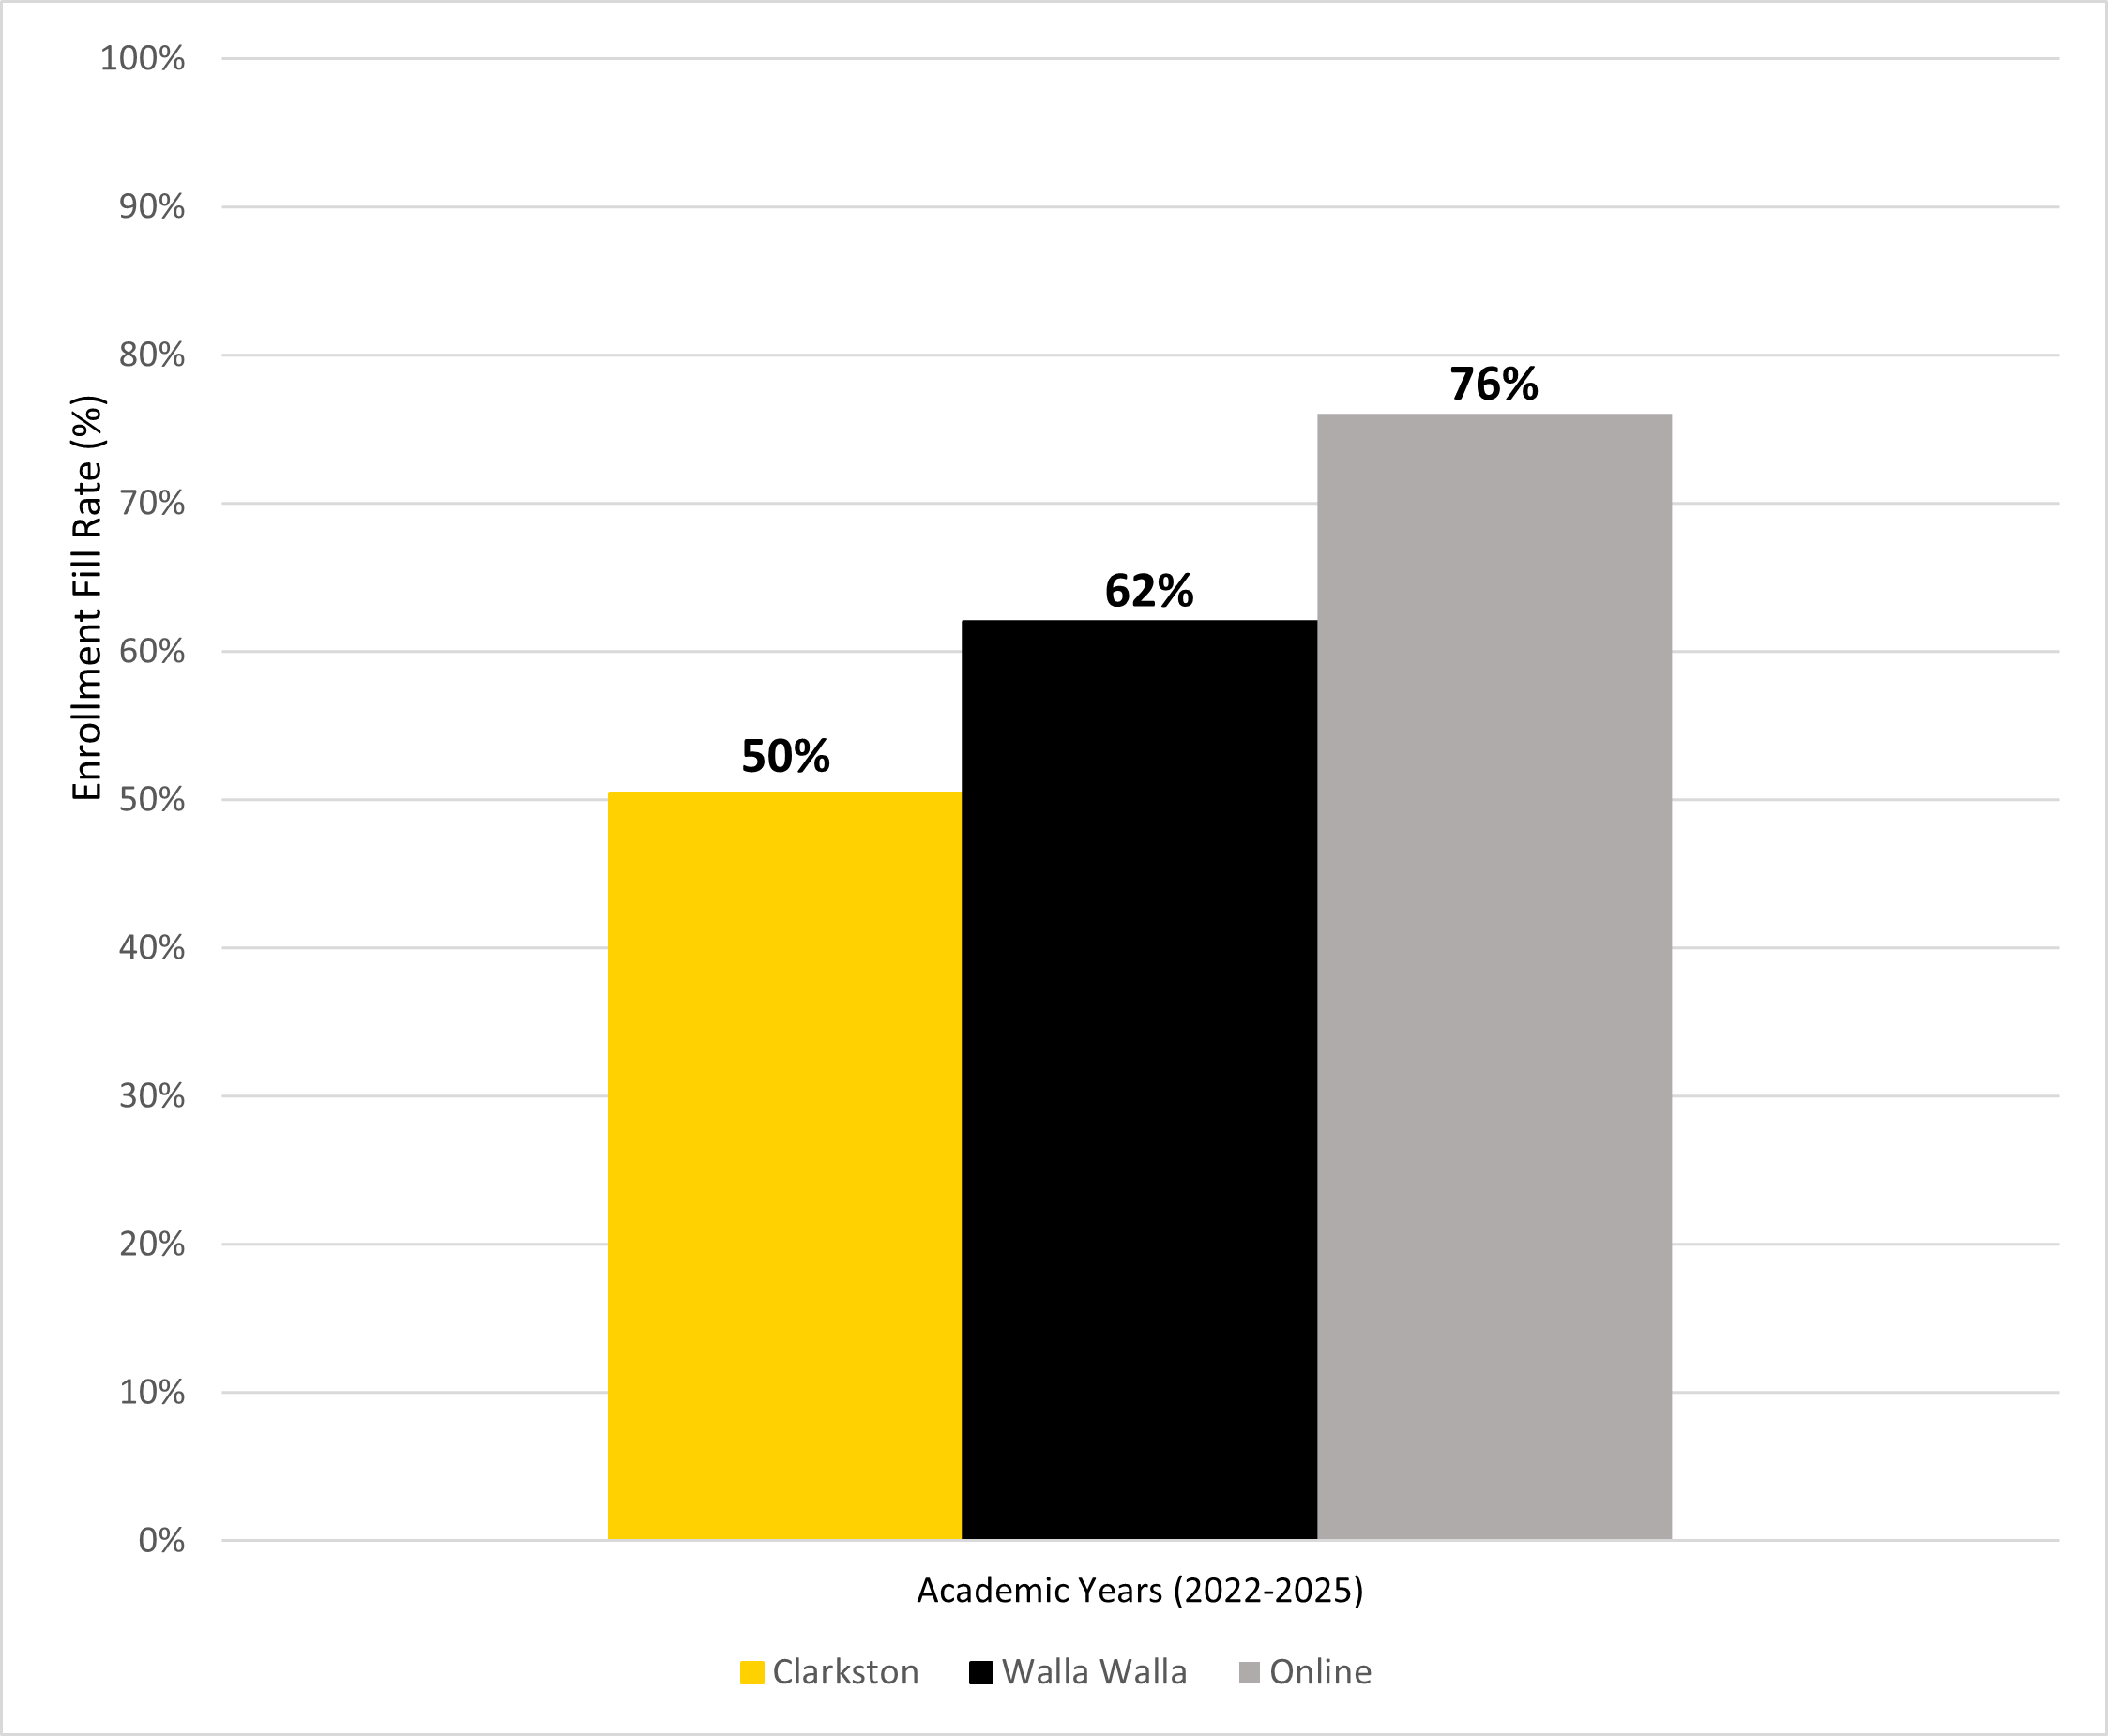
A&S Fill Rates Average
 Click image to enlarge
Data represented include both state and contract funded (Running Start) enrollments for Arts and Science courses above 100 level at Clarkston, Walla Walla, and Online locations averaged over the last three years – 2022-2025. (Note: This data set excludes the Nursing-specific PHIL and PSYC courses).
The Role of Online Learning
In 2015-16, online learning began rapid scaling nationally and in the SBCTC system. Competitors like Western Governors, WSU-Global, University of Phoenix and others gained a foothold. Online availability reduced demand for in-person classes while still serving broad areas of rural eastern Washington. Source
Since 2015–16, online instruction has expanded across the country—including at WWCC. Many students now choose the flexibility of online options, especially in rural areas. Online courses now make up around 40% of our offerings, a number that’s remained steady for the past few academic years.
Change in Percent of Instruction Online (2013-2024)
 Click image to enlarge
Data includes state funded and Running Start students and excludes Corrections Education.